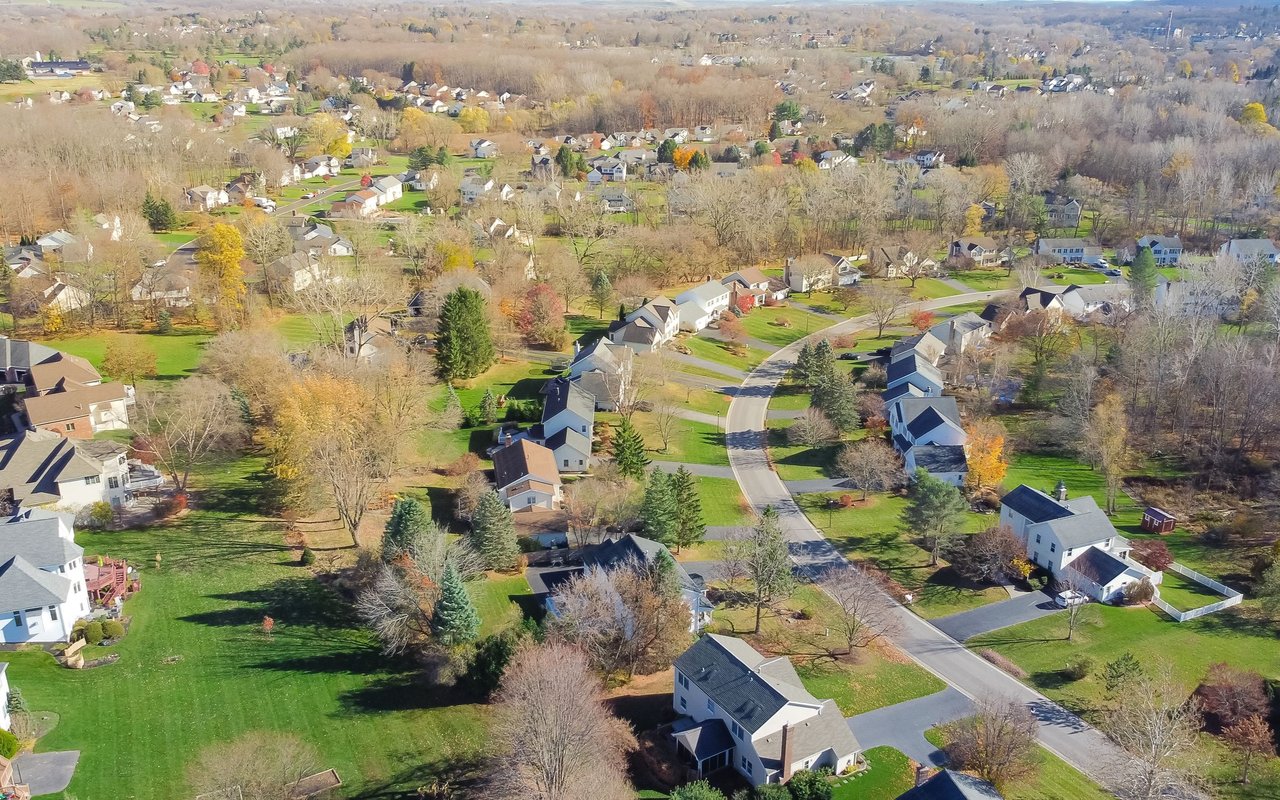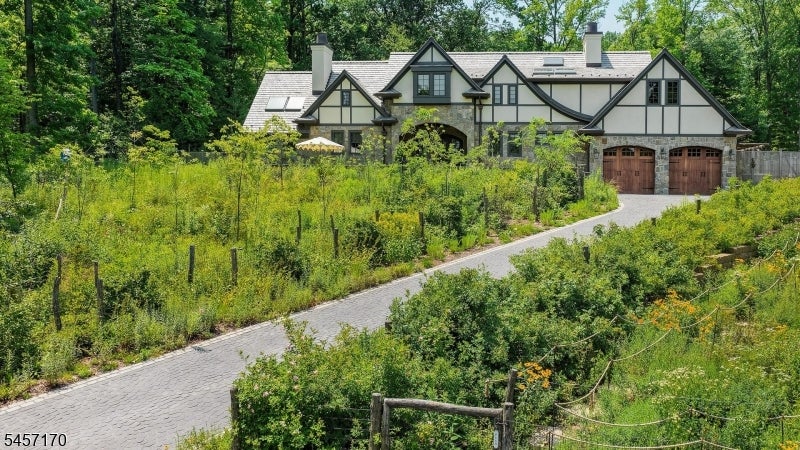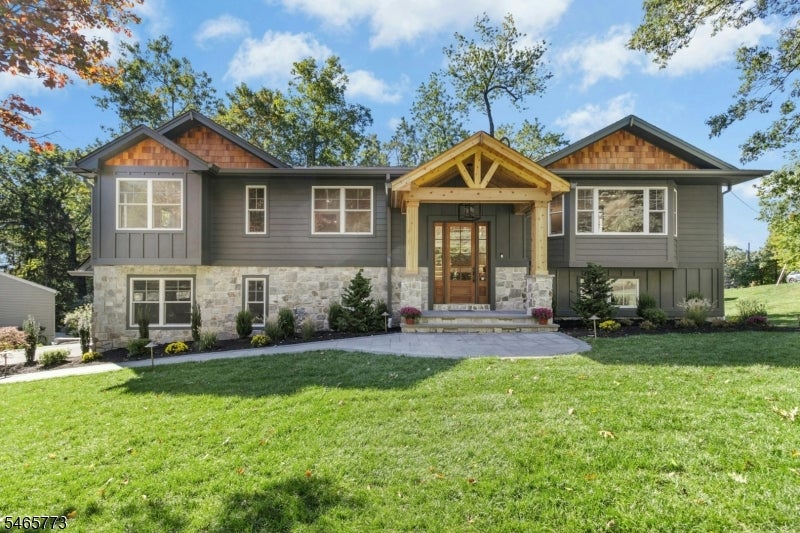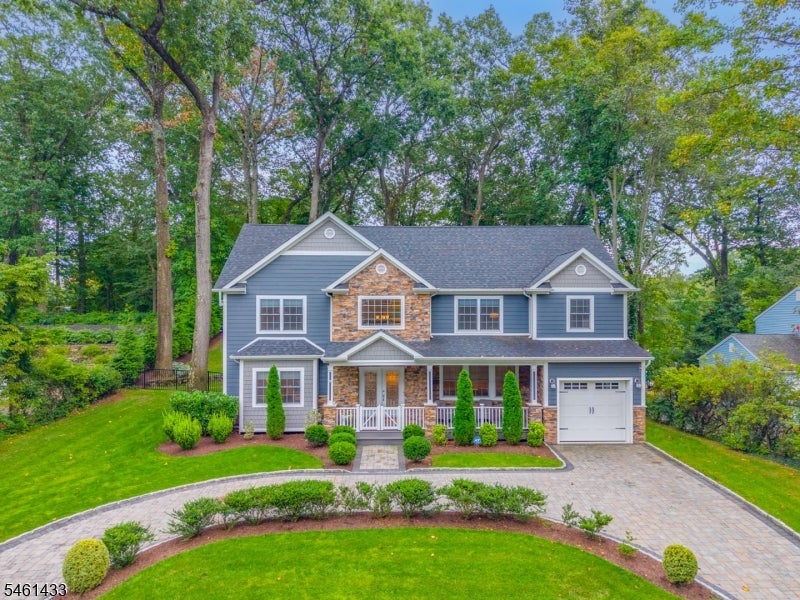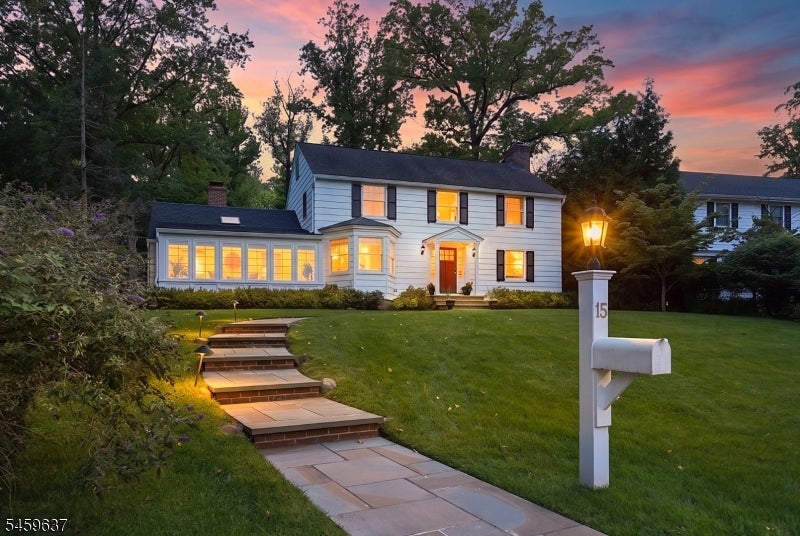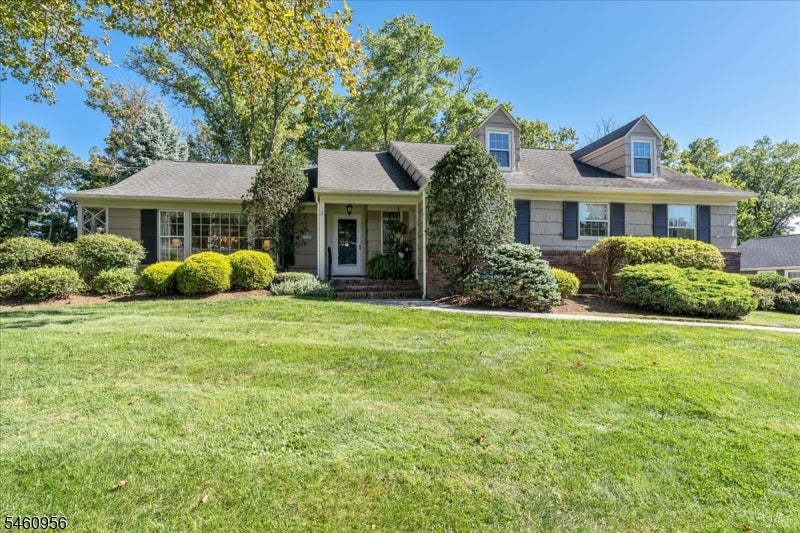
In the fantastic area of Mountainside you’ll be in good company with around 7,003 residents with around 85% of those homeowners. With an average age of 51, the residents of Mountainside are fairly quiet and laid back, with many of them just about reaching retirement, or already retired. Many have downsized and picked Mountainside as their new home thanks to its peaceful and quiet environment. Over the past 30 days roughly 11 homes have been sold with an average sold price of 1,224,450. That is an increase of $157,498 from the previous period.
7,049 people live in Mountainside, where the median age is 48 and the average individual income is $84,985. Data provided by the U.S. Census Bureau.
Total Population
Median Age
Population Density Population Density This is the number of people per square mile in a neighborhood.
Average individual Income
There's plenty to do around Mountainside, including shopping, dining, nightlife, parks, and more. Data provided by Walk Score and Yelp.
Explore popular things to do in the area, including Bella's Custom Cakes & Catering LLC, Watchung Day Camp, and Echo Lake Snack Bar & Boat Rentals.
| Name | Category | Distance | Reviews |
Ratings by
Yelp
|
|---|---|---|---|---|
| Dining | 0.8 miles | 0 reviews | 0/5 stars | |
| Active | 0.44 miles | 0 reviews | 0/5 stars | |
| Active | 1.05 miles | 1 review | 5/5 stars | |
| Beauty | 0.71 miles | 0 reviews | 0/5 stars | |
| Beauty | 0.98 miles | 1 review | 5/5 stars | |
|
|
||||
|
|
||||
|
|
||||
|
|
||||
|
|
||||
|
|
Mountainside has 2,508 households, with an average household size of 2.76. Data provided by the U.S. Census Bureau. Here’s what the people living in Mountainside do for work — and how long it takes them to get there. Data provided by the U.S. Census Bureau. 7,049 people call Mountainside home. The population density is 1,765 and the largest age group is Data provided by the U.S. Census Bureau.
Total Population
Population Density Population Density This is the number of people per square mile in a neighborhood.
Median Age
Men vs Women
Population by Age Group
0-9 Years
10-17 Years
18-24 Years
25-64 Years
65-74 Years
75+ Years
Education Level
Total Households
Average Household Size
Average individual Income
Households with Children
With Children:
Without Children:
Marital Status
Blue vs White Collar Workers
Blue Collar:
White Collar: